The budget in six charts

While a surplus of around $4 billion has been recorded in this year’s budget, it is not projected to last. A slowdown in GDP growth is expected, and a deficit – likely to continue for years – is forecast for the 2023-24 financial year.
The main magnitudes for 2023-24 are given in Table 1. Receipts include the big-ticket items like individual taxation and the GST, earnings on the investments of the Future Fund, and relatively smaller non-tax income from things like fees from issuing visas, and dividends from the post office. Payments include capital items such as military equipment, public service salaries, income support payments, and various other program expenditures. The cash balance is simply receipts minus payments, while debt is the money borrowed to finance previous deficits.
Table 1: Main magnitudes in 2023-24 budget
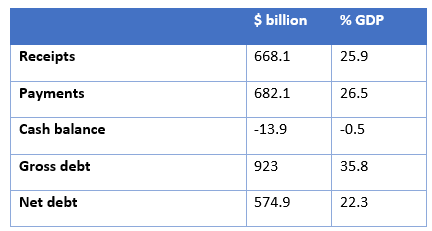
The third column of Table 1 shows that receipts and payments are each a bit over a quarter of GDP. Gross debt, the total value of government debt, is well over a third of GDP. But since some of the debt is held within the government, and some of it is offset by other financial assets, the net debt figure – which is just under a quarter of GDP – is the more important. Net debt can be calculated by taking gross debt, which is the value of all outstanding government bonds and other securities, and deducting the financial assets held by the government. Doing this shows that the deficit represents a paltry 0.5 per cent of GDP.
More of the same
Newton’s first law of motion says that, “a body in motion … will remain in motion … unless acted upon by an outside force”. Budgets are similar. The taxation and spending they detail is mostly the same year to year, until it is affected by matters outside government control – like big changes in iron ore prices. Prices have increased since the low of the pandemic, which is why this year’s budget includes policy decisions to increase receipts from Australia’s iron ore reserves by $1.8 billion. This additional revenue will allow the government to increase spending by $13.8 billion for 2023-24. For the forward estimates as a whole, receipts have increased by $22.1 billion (just 0.65%), and payments have grown by $42.6 billion (1.21%). Those figures apply to 2023-24, which means that almost all the present budget was a continuation of the previous (October 2022) budget. However, many of the decisions taken in the 2023-24 budget are designed to come into effect in later years. This means their impact will be larger. For example, by 2026-27, receipts will increase to $8.4 billion (up 1.1%), and payments will increase to $7.87 billion (up 1.1%). These changes are small, and show that the government has made mere incremental changes to budget magnitudes.
These changes are summarised in Table 2.
Table 2: Effect of new policy, parameter and other variations on budget totals
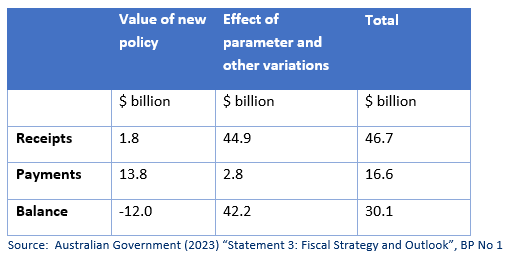
The “effect of parameter and other variations” could equally be described as a correction of the errors the previous budget made when it tried to forecast for 2023-24. The 2023-24 budget contains forecasts not only for this year, but for the following three years. These latter forecasts tend to be very heroic – the further away they are, the more likely they are to be wrong. This is why the budget provides information on the likely error based on past experience.
The following graph (Figure 1) is reproduced from the budget papers and shows the central forecast for the budget balance, along with confidence intervals. The figures are measured as shares of GDP.
Figure 1: Cash balance estimates and confidence intervals, % GDP
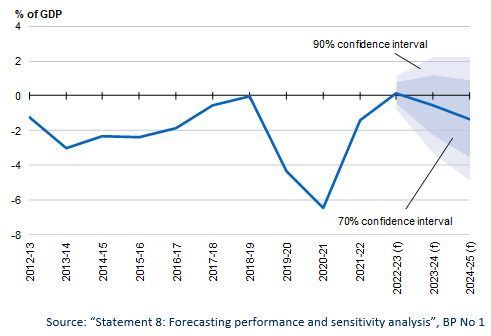
Figure 1 shows us that we can be 90 per cent sure that the cash figure in the 2024-25 budget will fall between a deficit of 3.3 per cent of GDP and a surplus of 2.2 per cent of GDP. To put that into a dollar value, Treasury are saying in 2024-25 they are 90% certain that the budget outcome could be anywhere between a surplus of $37.4 billion and a deficit of $107.6 billion. That is quite a range.
New measures are itemised in more detail in Budget Paper No 2, called “Budget Measures”. But the items announced in the budget are only plans, and there are many things that can get in the way of their realisation, including the failure to turn announcements into legislation. That is where the Senate plays a big role. A lot of the worst features of Joe Hockey’s 2014 “horror” budget, for example, never made it past the Senate.
Taxation
Table 3 presents the main taxation categories in the 2023-24 budget.
Table 3: Main tax categories, $billion and % of total
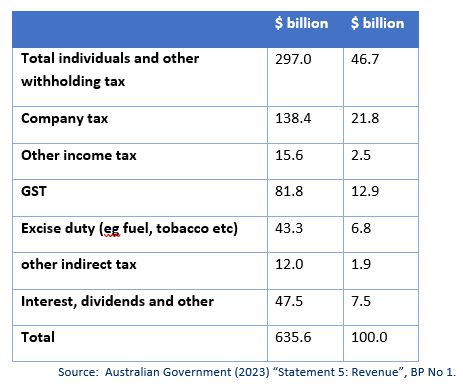
Income taxes on individuals and companies are the main source of tax in Australia, together accounting for 69.5% of all revenue. Interest, dividends and other non-tax revenues are, meanwhile, a rather small share of total revenue.
Payments
Table 4 presents the main spending items in the budget, as presented in the budget papers. The estimates are given for 2022-23, and for 2023-24.
Table 4: Functional classification of spending
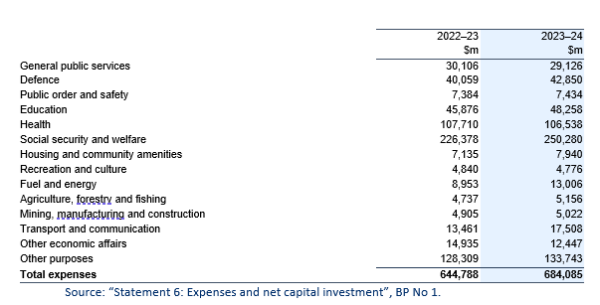
There is large variation in the size of these classifications. Each of them grow at much the same rate, although there are some exceptions.
To better appreciate the relative importance of some of the payments, the data for 2023-24 are presented in Figure 2. These give the shares of government spending by function (assuming the government’s plans are implemented) and express them as a share of total spending.
Figure 2: Payments by function as percent of total payments
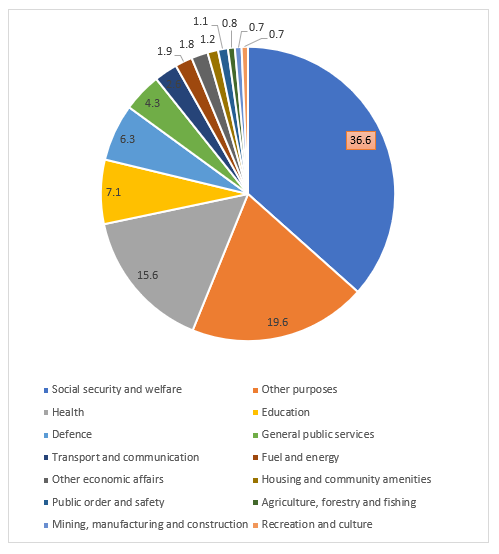
Figure 2 shows that the biggest payments category is social security and welfare, which accounts for over a third of all spending. At 19.6%, the hodgepodge “other purposes” is next, followed by health (15.6%), education (7.1%) and defence (6.3%).
Tax expenditures
Tax expenditures arise when exemptions from a general tax are given to a favoured group. For example, small business is only required to pay 25% company tax compared with 30% for all other companies.
The most significant expenditures are:
- Capital gains tax (CGT) exemptions for owner-occupied housing at $48 billion for 2022-23,
- Rental deductions at $24.4 billion,
- CGT discount for individuals and trusts at $23.7 billion,
- Concession for employer super contributions at $23.3 billion and
- Concession for super entity earnings at $21.5 billion.
All up, the top 38 tax expenditures listed in the 2023-24 budget papers cost $238 billion in 2022-23. If those tax expenditures were put on the spending side of the budget, payments would increase by 37 per cent, to $882 billion.