Population growth is in the news again. The usual suspects are trying to whip up a scare campaign about immigration. So, let’s look at the actual numbers and put them into context.
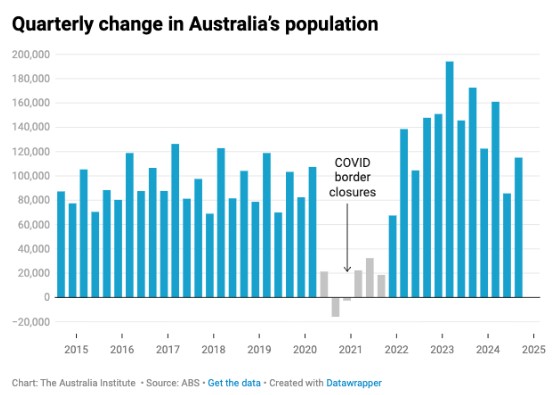
Recent growth in Australia’s population has gone through historically big swings, starting with the closure of borders during the Covid pandemic.
This resulted in the population falling, as many people, such as foreign students, left the country. There was a period of about 18 months (from early 2020 to late 2021) where population growth was at historic lows.
When the borders reopened, many people came back and we had a period where the population increased more rapidly.
Since 2024, population growth appears to have fallen back to pre-Covid rates.

But has the bounce-back in population been larger than the slowdown during Covid? To see that, we need to project growth assuming that the population grew at the average pre-Covid rate.
If we do, we can see that the actual population is lower than it would have been if the Covid pandemic had not occurred. The actual growth in the population is the blue line and the projected number without the pandemic is the dotted orange line.

The other big claim we hear is that the housing crisis is being driven by population growth. The argument is that the population is growing at faster than we are building houses. It says this is leading to a shortage of houses, which is pushing up price.
Fortunately, we have a fantastic natural experiment to test if this is true.
As we have discussed, during Covid, when borders were shut, we had a period of unprecedented low population growth. If growth in the population was really the cause of high house prices, then during this period we should see prices flatline, or even fall.
If we look at house price growth in the past 35 years, we can see for the Covid period (highlighted in orange), prices didn’t stay flat or fall. In fact, they rapidly increased.
This was because during this time the Reserve Bank cut interest rates. But it highlights that population growth does not appear to have a strong impact on house prices.

The idea that population is growing at a faster rate than housing is also not supported by the data.
In the past 10 years, the population has increased by 16 per cent. That means, for Australia to maintain the same average number of people per dwelling, the number of dwellings needs to increase by at least 16 per cent. But over those 10 years the number of dwellings rose by 19 per cent.

But the housing crisis dates back much further than 10 years. House prices really started to rapidly increase in the early 2000s.
Unfortunately, the Australian Bureau of Statistics does not have quarterly dwelling data that goes back much beyond 10 years. But we do have census data.
As part of the process of counting everybody in Australia, the census counts how many dwellings there are. If we compare the 2001 census with the most recent census in 2021, we can look at the increase in the population and compare it with the increase in the number of dwellings.
Over the 20 years from 2001 to 2021, the population increased by 34 per cent, while the number of dwellings increased by 39 per cent.
Even over such a long time period that captures the whole period of the housing crisis, we are building homes at a faster rate than the population has increased.
Scare campaigns about immigration are as old as history. But the latest version of them falls apart when subject to the evidence.
The Covid period massively disrupted population growth by first slowing it to unprecedented rates before bouncing back with a period of more rapid growth.
Discussion about this period needs to include the whole context and not just selectively pick at parts to make a political point.
Between the Lines Newsletter
The biggest stories and the best analysis from the team at the Australia Institute, delivered to your inbox every fortnight.
You might also like
Migration is not out of control and the figures show it is not to blame for the housing crisis
Migration is not to blame for house prices rising. And neither are Australia’s borders out of control.
As fascism rears its ugly head, we are trapped between the craven and the unwilling
Let’s take a bit of a look at responsibility shall we?
Productivity is often mistaken for wages. What does it really mean? How does it work?
Australia’s productivity growth has reverted to the same stagnant pattern as before the pandemic, according to the Productivity Commission’s latest quarterly report. Productivity is complex and often misunderstood in media and policy debates. So before we read too much into this latest data, here are six key things to understand about productivity. 1. It’s about quantities,


